Spectators cheering at a basketball game

A Math Course Inspired by TikTok & Basketball

Back to All Perspectives Stories
Nancy Joseph 03/03/2026 March 2026 Perspectives
Maddy Brown in a t-shirt and baseball cap stands on a basketball court.
“I realized I wasn’t seeing a lot of WNBA analytics or even much talk about WNBA statistics on TikTok. So I thought, ‘Why not do it myself?’" Maddy Brown says of her TikTok page, wnbadata. Photo by Juan Rodriguez.

What do women’s basketball, TikTok, mathematics, and undergraduate teaching have in common?

Madeline (Maddy) Brown.

Brown (BS, Mathematics, Physics, 2020; MS, Mathematics, 2022), a University of Washington doctoral student in mathematics, has more than 13.5K followers and 1 million “likes” on her TikTok page (wnbadata), where she analyzes Women’s National Basketball Association (WNBA) statistics.

Recently, that TikTok content led Brown to create a Department of Mathematics course,  “Communicating Mathematics Through Sports Data,” which focuses on making complex mathematical concepts accessible to non-mathematicians.

“I’ve spent years making TikTok videos where I have sixty seconds to hook someone, explain a concept, and make them care about WNBA stats, but stretching that same philosophy across an entire quarter forced me to really articulate why storytelling matters and how to teach it,” Brown says.

Analyzing the WNBA on TikTok

From an early age, Brown played and watched sports, especially basketball and softball. Her interest in mathematics came later. As a UW undergrad, she majored in physics, then added a second major in mathematics as the courses she took sparked her curiosity.

“With each math class, I wondered, ‘What can possibly come after this?’ I needed to find out what was next,” she says. “That’s why I kept going.”

Maddy Brown sitting in front of a TV screen, talking into a handheld mic.
Brown has more than 13.5K TikTok followers — including at least one WNBA player. 

With her dual interests in sports and math, it makes sense that Brown’s TikTok videos focus on sports data. But they didn’t start out that way. Her early content was about the UW campus, including a popular series about the best places to cry on campus. (Brown recommends a side entrance to Mary Gates Hall, with a bench and bushes that provide some privacy.)

“I was somewhat awkward in those early TikToks,” Brown says. “I was just having fun with it, but I also saw that there was an opportunity to reach different audiences.”

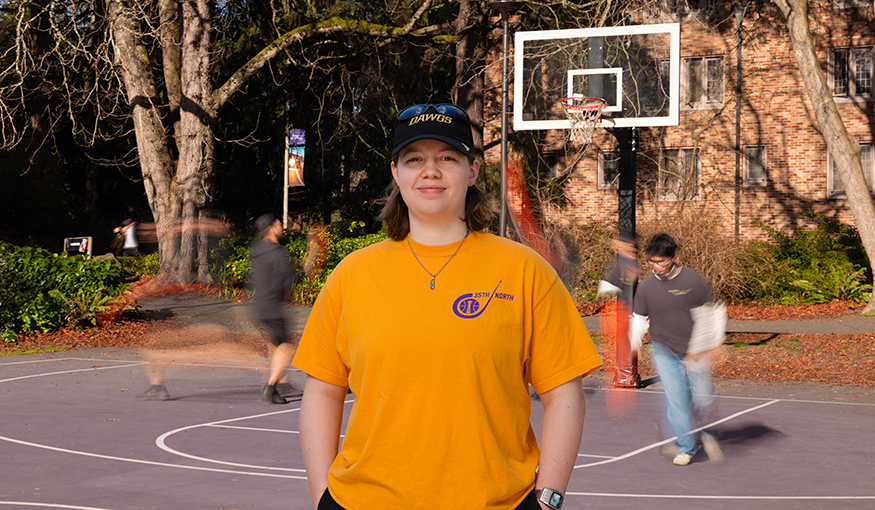
She began adding sports content in 2022, after the Seattle Storm — Seattle’s WNBA team — returned to Climate Pledge Arena after the building’s multi-year renovation. She attended most games and recapped them on TikTok. Around the same time, she began reading books about basketball analytics. That led to an “ah-ha” moment.

 “I realized I wasn’t seeing a lot of WNBA analytics or even much talk about WNBA statistics on TikTok,” Brown recalls. “So I thought, ‘Why not do it myself?’ I didn’t know that much about getting or analyzing data, so each video was an opportunity to learn something new and tell people about it.”

Brown’s TikToks often address questions that come to mind while watching games. In one, she analyzes the statistical difference in performance when Seattle Storm fans yell loudly during the opposing team’s free throws. In another, she looks at two college teams — one that shoots frequently and one that waits for the shot-clock to run out — to discuss how you calculate possessions and pace in a basketball game.

“You can’t just give someone numbers or a formula,” she says. “It’s easier if you paint a picture. You have to give the audience a reason to stay until the end of the story and wait for the payoff.”

A Math Course with Storytelling

Brown shares these lessons, learned through trial and error, with her students. She had experience teaching mathematics before offering her sports data course — she received the Department of Mathematics Excellence in Teaching Award in 2024 — but teaching advanced linear algebra is quite different than creating a new course about presenting data through storytelling.

At first, Brown’s students struggled mightily when asked to explain sports analytics concepts to a non-math audience. But after Brown shared how to hook an audience, structure an explanation clearly, and use examples and illustrations effectively, they improved. The course included a field trip to a Seattle Storm game (with reduced-price tickets covered by the department), after which students prepared a statistical analysis of some aspect of the game.

You can’t just give someone numbers or a formula. It’s easier if you paint a picture. You have to give the audience a reason to stay until the end of the story and wait for the payoff.

Maddy Brown UW Doctoral Student, Mathematics

For the final course assignment, each student produced a five-minute video exploring a statistical question of their choosing. Maggie Petersen, an avid football fan with a double major in math and education studies, focused on winning streaks. Their video analyzed the wins and losses of each NFL team during the 2024 season to assess the likelihood of winning the next game after winning a game. (They concluded that streaks did not exist during that NFL season.)

“I had a lot of fun making my final project,” Petersen says. “It’s not often that I do a project where I get to be surprised by my findings. Usually I know what the correct answer is before I get started, but this time I got to discover the answer as I went along.”

The hardest part? Explaining the math and the findings in less than five minutes. “There was so much I wanted to say about the work I had done and the math behind it!” Petersen says. “That element forced me to think about being concise in my communication.”

Prioritizing Context and Clarity

Petersen’s five-minute video was far longer than Brown’s TikTok videos. It’s taken time for Brown to master being clear, concise, and engaging in a short video, but knowing that people are watching has been motivating. Viewers have called her out for small missteps, such as not mentioning one step in a calculation or providing a detail that was correct but slightly confusing. The feedback has made her vigilant about clarity in her videos — though that doesn’t mean she ends videos with a definitive correct answer.

“With statistics and data, there isn’t always a right answer,” she says. “You could theoretically use the same numbers to tell very different stories. So it’s not just about getting an answer; it’s about explaining what you did to get this answer and what the answer would mean. Especially in the age of misinformation, being able to give more context to statistics is really important.”

For Petersen, that message was impactful.

“I think learning to communicate advanced concepts from one’s field of study, be it mathematics or anything else, is an incredibly valuable skill,” Petersen says. “It doesn’t matter how much knowledge or ability someone has if they’re unable to communicate their ideas to others.”

Read a blogpost by Maddy Brown about her course.

Check out Maddy Brown’s TikTok and Instagram videos.

More Stories

Eddie McClary does a high kick while lifting a red stool overhead during a dance performance.

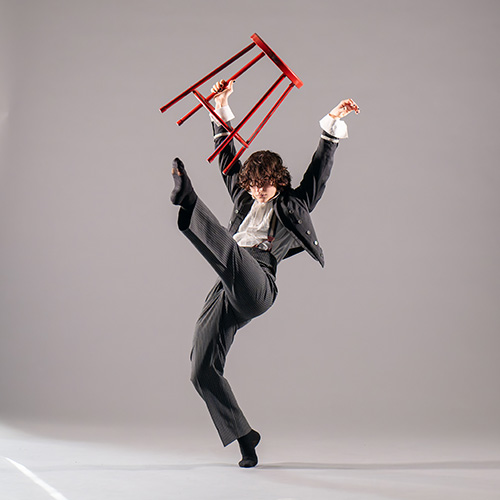
Finding Joy in Dance and STEM

“I feel like my experience at the UW has been incredibly well-rounded," says Eddie McClary, who graduates in June 2026 with bachelor's degrees in dance and biochemistry. 

Hunter Jung in a research lab, with shelves of lab equipment on either side of her.

Before Med School, A Year in Paris

Graduating with bachelor's degrees in neuroscience and French, Hunter Jung is heading to France for a cognitive neuroscience program that reflects both interests.

Two people excavating a shallow section at an archaeological site.

Unearthing Clues to Past Lives

Through summer excavations at a former plantation and an anthropology honors thesis, Raquel Matthews is advancing our understanding of the lives of enslaved people who lived there.